Case Study - How I implemented in-memory file cache that saved AWS $300,000 a month
While working at AWS, Thomas analyzed a slow package build, and implemented an efficient cache layer that resulted in over 99% hit rate.
- Client
- Amazon Web Services (AWS)
- Year
- Service
- Infrastructure Improvement

How I Reduced Build Times from >70 minutes to 2 Minutes: A Deep Dive into Build Pipeline Optimization
In the world of large-scale software development, build times can make or break developer productivity. At Amazon, we faced a challenging scenario where a single package update could trigger 85 hours of cumulative build time across our version sets. Here's how we identified the bottlenecks and achieved a 95% reduction in build times through systematic analysis and targeted optimizations.
The Challenge: Long build time that exacerbates with region launches
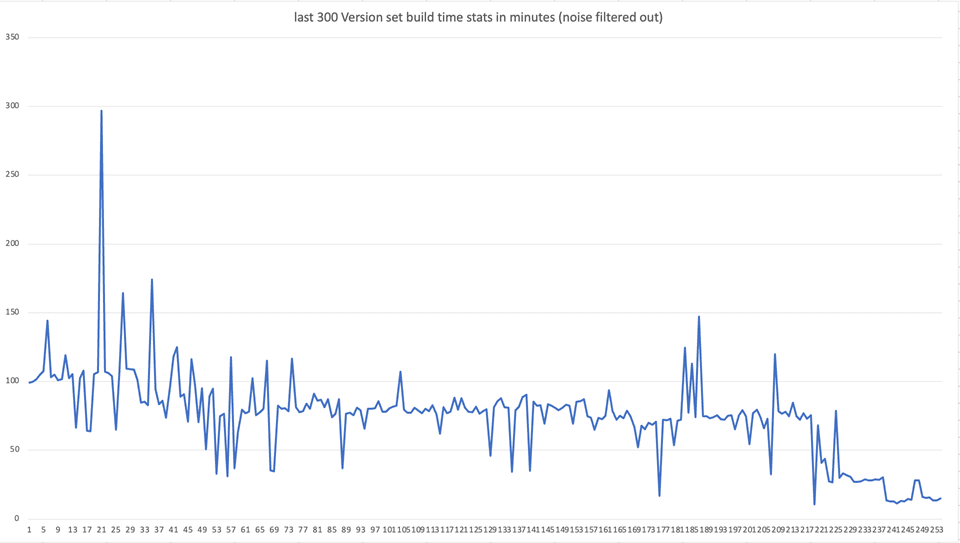
AWS currently operates in over 30 geographic regions. The package's build time was increasing when we launch new regions (me-central-1 was launching at the time).
Over time, the build targets, or version sets internally, that depend on this package saw an elevated build time as well.
At Amazon, we use "version sets" - collections of software packages that build into target artifacts. Think of it as a complex dependency graph where changes in one package can trigger rebuilds across multiple version sets. My specific challenge involved a critical package that was:
- A critical dependency for 85 different build targets ("version sets")
- Taking over 1 hour to build
This meant that any change to this core package would trigger a cascade of builds, effectively creating a massive bottleneck in our development pipeline.
The Investigation: Breaking Down the Build Pipeline
My first step was to perform a detailed analysis of the build pipeline. I broke down the build process into its constituent parts:
- Compilation
- Testing
- Linting
Through this analysis, I identified that the testing phase was our primary bottleneck. The initial optimization attempt focused on test parallelization:
- Initial approach: Parallelizing Ruby tests
- Result: Build time reduced from 1 hour to 20 minutes
- Learning: While significant, this improvement wasn't enough
The Breakthrough: Identifying IO Bottlenecks
The real breakthrough came when I discovered a critical inefficiency in our IO layer. The system was:
- Repeatedly reading files that were already in memory
- Performing redundant IO operations on unchanged content
- Wasting significant time on unnecessary disk operations
The Solution: Custom File Handler with In-Memory Caching
Due to security purposes, I cannot share the code detail. On a high level, in the package, I/O (file read and write) is handled through a file handler class. This has made my work much easier.
I implemented a new class called "SecretFilesCacheLoader" in Ruby that instantiates a static object (the in-memory cache map) internally. If the file path exists, it returns the blob of the file that has been cached. If the file path doesn't exist, it loads the file from file system (fs).
Now, one more function we need in the "SecretFilesCacheLoader" is the invalidate() function. It basically is called when a file is expected to be changed, and we call that function to remove it from our cache.
Once this sub-class is implemented, I can then call these static functions directly to interact with this in-memory cache. It took me about 2 hours to implement.
The results were dramatic:
- Build time reduced from 20 minutes to 2 minutes
- Cumulative time savings of 85 hours per commit across version sets
- Significant reduction in resource utilization
One thing to be aware is that our file size in total was about 200MB, so all these files can fit into a modern day computer, easily. However, this implementation wouldn't be sufficient if our file size is over 3-4GB. That will require using eviction algorithm. Fortunately, in our use case, the folder size is quite predictable.
Business Impact
The optimization delivered substantial benefits:
Immediate Cost Savings
- Reduced compute resource usage
- Decreased developer wait times
- Lower operational costs for CI/CD infrastructure
Developer Productivity
- Faster feedback cycles
- Reduced context switching
- More efficient code review process
Emergency Response Capability
- Drastically reduced impact window for critical updates
- Improved ability to deploy emergency fixes
- Enhanced system reliability
ROI Analysis
Consider the following metrics:
- Average software engineer salary
- Number of commits per day
- Previous build time: 85 hours
- New build time: 2 minutes
- Daily time savings: 6 engineer-hours
- Monthly cost savings: $10,000 in engineer productivity

Key Learnings
- Start with Data: Detailed analysis of build stages helped identify the real bottlenecks
- Iterative Improvement: The first optimization (test parallelization) was good but not sufficient
- Look Beyond the Obvious: The major gains came from addressing IO inefficiencies, not just test execution
- Think Systematically: Consider the impact across the entire dependency graph
Conclusion
This optimization project demonstrates the importance of systematic analysis and the potential impact of targeted technical improvements. While test parallelization provided initial gains, the transformative improvement came from understanding and optimizing the underlying IO patterns.
Would you like to learn more about how we can help optimize your build pipeline? Contact us for a consultation.
What I did
- DevOps
- CI/CD optimization
- Low-level code analysis
- Efficient caching implementation
Thomas's changes resolved so many bottlenecks that they will be a gift that keeps on giving.

Senior Engineer of Amazon Project Kuiper
This is great! As Rene mentioned, it improves not only our productivity but also that of many other teams (think of all the build fleet resources we'll free up for other teams to use).

Principle Engineer of AWS ECS Fargate
- Build time ptimized
- 95%
- Hours saved per code commit
- 85
- Monthly server time saved
- $300,000